Question
Given the following data to answer the questions below: 1. graph the consumption function, with consumption spending on the vertical axis and disposable income on the horizontal axis. 2. if
the consumption function is a straight line, what is its slope? 1. fill in the saving column at each level of income. If the saving function is a straight line, what is its slope? • If consumption increases by $12 billion when disposable income increases by$15 billion, what is the value of the MPC? What is the relationship between the MPC and the MPS? If the MPC increases, what more happen to the MPS? How is the MPC related to the consumption function? How is the MPC related to the consumption function? How is the MPS related to the savings function?


Fig: 1
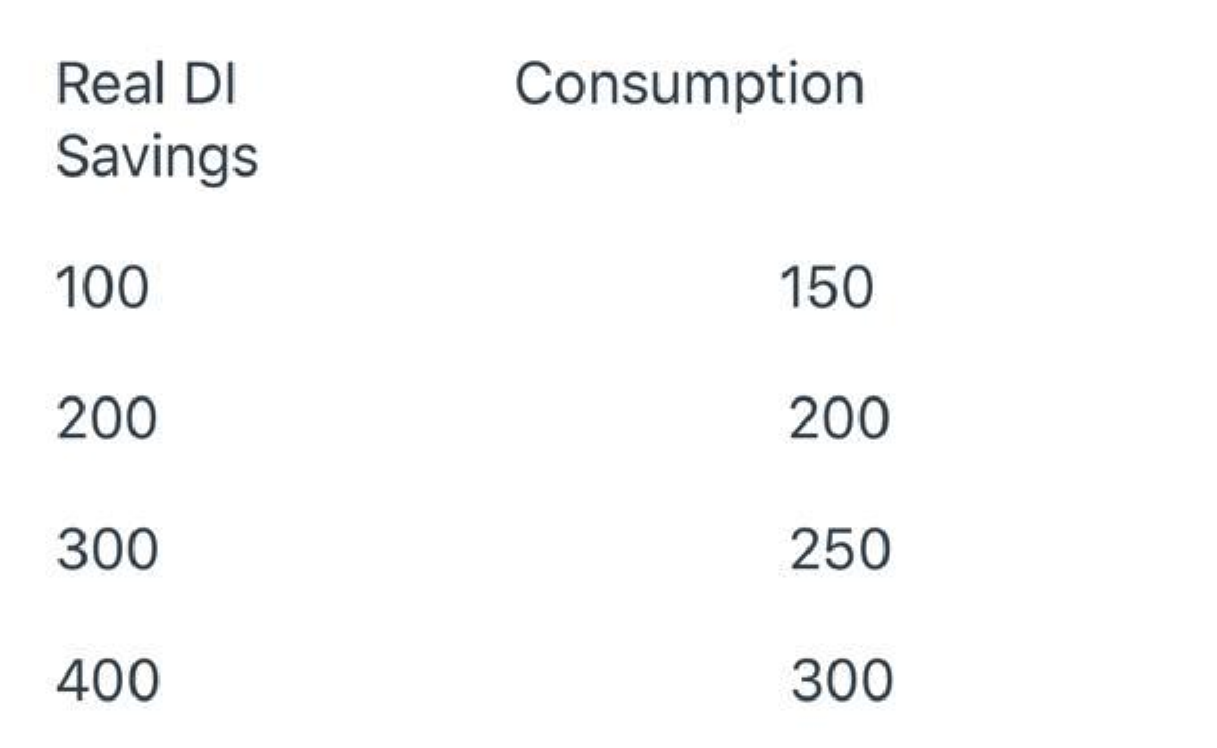
Fig: 2

Fig: 3

Fig: 4

Fig: 5

Fig: 6

Fig: 7

Fig: 8

Fig: 9

Fig: 10


