


Question

3

The raw data in this question is the "Pew Research Center's American Trends Panel" Wave

69 Field dates: June 16 - June 22, 2020 Topics: Coronavirus tracking, politics, 2020 Census

data and questionnaire downloaded 3/4/2021 from

https://www.pewresearch.org/politics/dataset/american-trends-panel-wave-69/

The codebook was downloaded 3/5/2021 from https://www.pewresearch.org/wp-

content/uploads/2018/05/Codebook-and-instructions-for-working-with-ATP-data.pdf

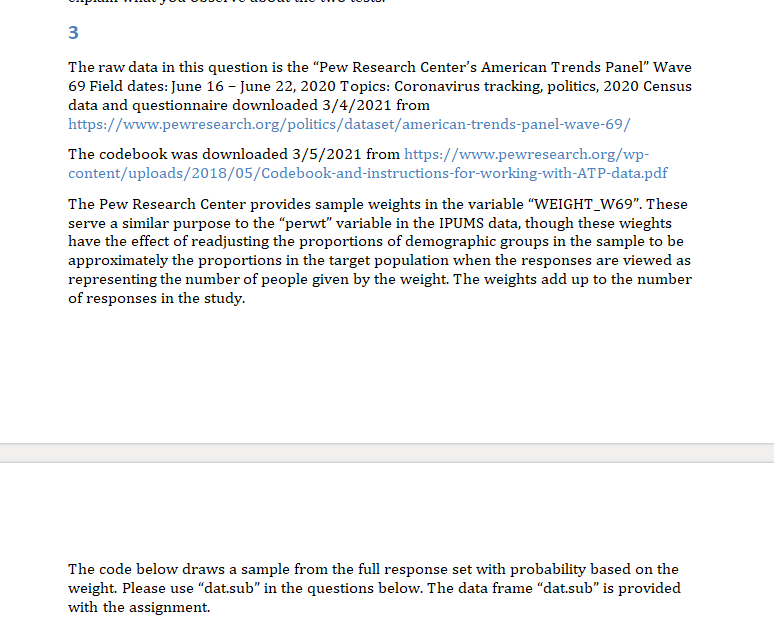
The Pew Research Center provides sample weights in the variable "WEIGHT_W69". These

serve a similar purpose to the "perwt" variable in the IPUMS data, though these wieghts

have the effect of readjusting the proportions of demographic groups in the sample to be

approximately the proportions in the target population when the responses are viewed as

representing the number of people given by the weight. The weights add up to the number

of responses in the study.

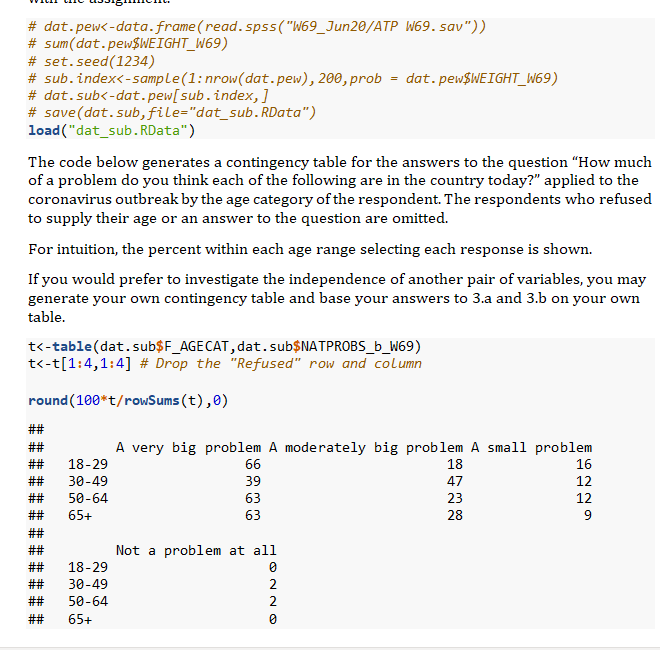
The code below draws a sample from the full response set with probability based on the

weight. Please use "dat.sub" in the questions below. The data frame "dat.sub" is provided

with the assignment./n# dat.pew<-data.frame(read.spss("W69_Jun20/ATP W69. sav"))

# sum(dat.pew$WEIGHT_W69)

#set.seed (1234)

# sub.index<-sample (1: nrow(dat. pew), 200, prob

# dat.sub<-dat.pew[sub. index,]

# save (dat.sub, file="dat_sub. RData")

load("dat_sub. RData")

The code below generates a contingency table for the answers to the question "How much

of a problem do you think each of the following are in the country today?" applied to the

coronavirus outbreak by the age category of the respondent. The respondents who refused

to supply their age or an answer to the question are omitted.

For intuition, the percent within each age range selecting each response is shown.

If you would prefer to investigate the independence of another pair of variables, you may

generate your own contingency table and base your answers to 3.a and 3.b on your own

table.

round (100*t/rowSums (t), 0)

##

##

t<-table(dat.sub$F_AGECAT, dat.sub$NATPROBS_b_W69)

t<-t[1:4,1:4] # Drop the "Refused" row and column

##

18-29

30-49

50-64

65+

##

##

##

##

18-29

## 30-49

## 50-64

## 65+

Not a problem at all

A very big problem A moderately big problem A small problem

66

18

16

39

47

12

63

23

12

63

28

9

ONNO

=

0

dat. pew$WEIGHT_W69)

2

2/n3.a

(10 points)

Please use the test to test the independence of the probability

distribution with the outcomes in the rows and the probability distribution

with the outcomes in the columns for the table you chose. Is this an

appropriate test for your table? If not, why not? If so, please respond to the

question of whether the data are consistent with the null hypothesis that the

row distribution and the column distribution are independent.

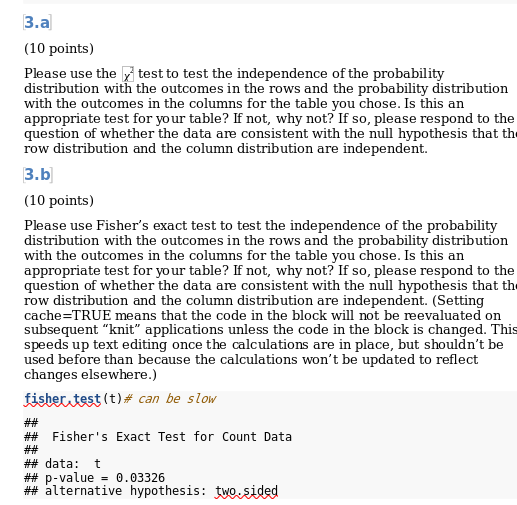
3.b

(10 points)

Please use Fisher's exact test to test the independence of the probability

distribution with the outcomes in the rows and the probability distribution

with the outcomes in the columns for the table you chose. Is this an

appropriate test for your table? If not, why not? If so, please respond to the

question of whether the data are consistent with the null hypothesis that the

row distribution and the column distribution are independent. (Setting

cache=TRUE means that the code in the block will not be reevaluated on

subsequent "knit" applications unless the code in the block is changed. This

speeds up text editing once the calculations are in place, but shouldn't be

used before than because the calculations won't be updated to reflect

changes elsewhere.)

fisher test (t)# can be slow

##

## Fisher's Exact Test for Count Data

##

## data: t

## p-value = 0.03326

## alternative hypothesis: two.sided

Question image 1Question image 2Question image 3