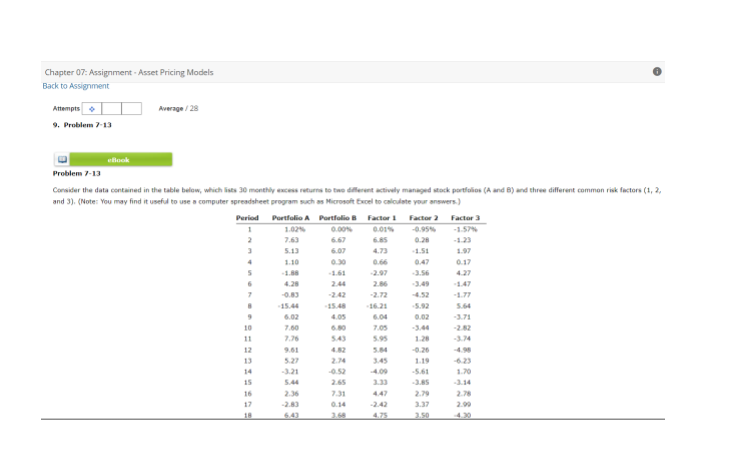
Chapter 07: Assignment-Asset Pricing Models Back to Assignment Attempts 9. Problem 7-13 eBook Average/28 Problem 7-13 Consider the data contained in the table below, which lists 30 monthly excess returns to
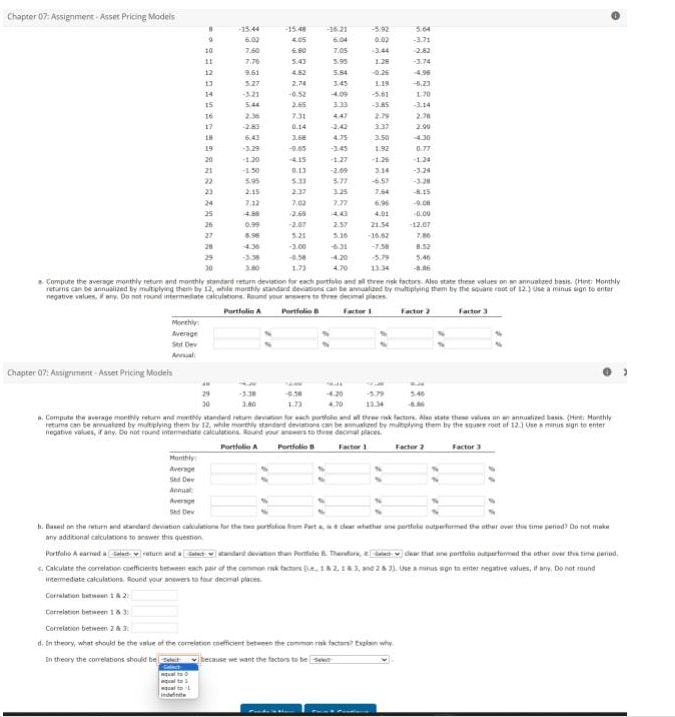
two different actively managed stock portfolios (A and B) and three different common risk factors (1, 2, and 3). (Note: You may find it useful to use a computer spreadsheet program such as Microsoft Excel to calculate your answers.) Factor 2 Factor 3 Portfolio A Portfolio B 1.02% 0.00% 7.63 6.67 5.13 6.07 1.10 -1.86 4.28 -0.83 -15.44 6.02 7.60 7.76 Period 1 2 3 5 6 7 9 10 11 12 13 14 15 16 17 9.61 5.27 -3.21 5.44 2.36 0.30 -1.61 2.44 4.05 5.43 2.74 -0.52 2.65 7.31 0.14 Factor 1 0.01% 6.85 4.73 0.66 -2.97 2.86 -2.72 -16.21 6.04 7.05 5.95 5.84 3.45 -4.09 3.33 4.47 -2.42 4.75 0.26 -1.51 0.47 -3.56 0.02 1.19 -5.61 2.79 3.37 3.50 -1.23 0.17 4.27 5.64 -3.71 1.70 2.99/nChapter 07: Assignment-Asset Pricing Models Monthly Average Sed Dev Chapter 07: Assignment-Asset Pricing Models Monthly Sed Dev B 9 10 Average HEDSGRANR 11 12 13 equal to 1 alto indefinite 14 15 16 17 18 19 20 21 22 23 24 25 26 27 29 29 -15.44 6.02 7.60 29 7.76 9.61 5.27 -3.21 5.44 2.36 -2.83 6.43 -3.29 -1.20 -1.50 5.95 2.15 7.12 4.88 0.99 -3.38 3.80 -15.48 -16.21 6.04 -3.38 4.05 6.80 5.43 2,74 -0.52 2.65 7.31 0.14 1.66 -4.15 0.13 5.33 7.02 -2.69 -2.07 5.21 7.05 5.95 5.84 3.45 -4.09 3.33 4.47 4.75 -2.09 5.77 3.25 7.37 2.37 5.35 -4.20 -5.92 -3.44 1.28 1.19 -3.85 2.79 3.37 3.50 1.92 -1.26 3.34 -6.57 7.64 6.96 4.01 21.34 -16.62 -1.58 1.73 13.34 a. Compute the average monthly return and monthly standard return deviation for each portfolo and all three risk factors. Also state these values on an annualized basis. (Hint: Monthly returns can be annualized by multiplying them by 12, while monthly standard deviations can be annualized by multiplying them by the square root of 12.) Use a minus sign to enter negative values, any. Do not round intermediate calculations. Round your answers to three decimal places Portfolio A Portfolio B 5.64 -3.71 -2.82 -3.74 -4.96 -6.23 1.70 -3.14 2.76 2.90 -4.30 0.77 Correlation between 1 & 3 Correlation between 2 & 3: d. In theory, what should be the value of the correlation coefficient between the common risk factors? Explain why In theory the correlations should be select because we want the factors to be se -1.24 -3.24 -8.15 -9.08 -0.00 -12.07 1.73 13.34 a. Compute the average monthly return and monthly standard retum deviation for each portfolio and all three risk factors. Also state these values on an annualized basis. (Hint: Monthly returns can be annualized by multiplying them by 12, while monthly standard deviations can be annualized by multiplying them by the square root of 12.) Use a minus sign to enter negative values, if any. Do not round intermediate calculations. Round your answers to three decal places Portfolio A Portfolio B Factor 1 8.32 5.46 -8.86 Factor 2 Factor 3 Factor 2 b. Based on the return and standard deviation calculations for the two portfolios from Part & clear whether one portale outperformed the other over this time period? Do not make any additional calculations to answer this question Factor 3 Portfolio A earned a return and standard deviation than Portale B. Therefore, dear that one portfolo outperformed the other over this time period. <. Calculate the correlation coefficients between each pair of the common risk factors , 182, 183, and 2 & 3). Use a manus sign to enter negative values, if any. Do not round intermediate calculations, Round your answers to four decimal places Correlation between 1 & 2:/nChapter 07: Assignment-Asset Pricing Models -3.38 3.80 1.73 a. Compute the average monthly return and monthly standard return deviation for each portfolio and all three risk factors. Also state these values on an annualized basis. (Hint: Monthly returns can be annualized by multiplying them by 12, while monthly standard deviations can be annualized by multiplying them by the square root of 12.) Use a minus sign to enter negative values, if any. Do not round intermediate calculations. Round your answers to three decimal places. Factor 2 Factor 3 Portfolio A Portfolio B Factor 1 Monthly: Std Dev Annual: 29 4.70 -5.79 13.34 Sed Dev b. Based on the return and standard deviation calculations for the two portfolios from Part a, is it clear whether one portfolio outperformed the other over this time period? Do not make any additional calculations to answer this question. 5.46 Portfolio A earned a select return and a select-standard deviation than Portfolio B. Therefore, itect clear that one portfolio outperformed the other over this time period. c. Calculate the correlation coefficients between each pair of the common risk factors (e, 1&2, 1 & 3, and 2 & 3). Use a minus sign to enter negative values, if any. Do not round intermediate calculations. Round your answers to four decimal places. Correlation between 1 & 2: Correlation between 1 & 3: Correlation between 2 & 3: d. In theory, what should be the value of the correlation coefficient between the common risk factors? Explain why In theory the correlations should be -Select- because we want the factors to be elect independent of each other