GENERAL PHYSICS I LABORATORY
Measurement, Precision, Accuracy, and Experimental Error
Experimental Objectives:
• To determine the period of a pendulum with its error
• To determine the density of a wooden block, with its error
Learning Outcomes:
• Students will increase their familiarity with the metric system;
• Students will understand the limitations of various measuring instruments;
• Students will measure time intervals associated with periodic motion.
• Students will measure mass with a triple-beam balance;
• Students will measure lengths with a metric ruler and a vernier caliper;
• Students will understand sources of error in physical measurements
NOTE: Thoroughly review the Reference Section for Measurement and Its Uncertainities
Instruments Used to Measure Distance:
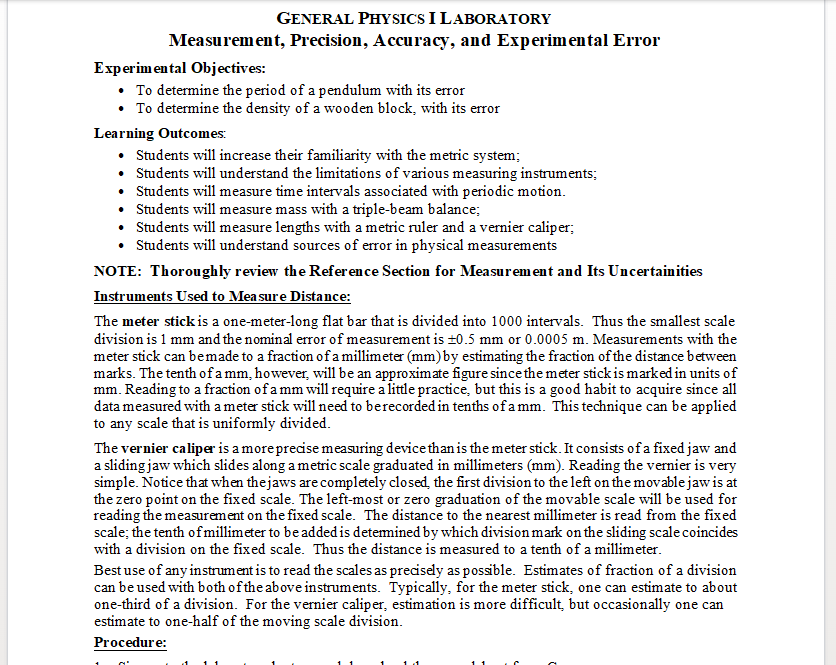
The meter stick is a one-meter-long flat bar that is divided into 1000 intervals. Thus the smallest scale
division is 1 mm and the nominal error of measurement is ±0.5 mm or 0.0005 m. Measurements with the
meter stick can be made to a fraction of a millimeter (mm) by estimating the fraction of the distance between
marks. The tenth of a mm, however, will be an approximate figure since the meter stick is marked in units of
mm. Reading to a fraction of a mm will require a little practice, but this is a good habit to acquire since all
data measured with a meter stick will need to be recorded in tenths of a mm. This technique can be applied
to any scale that is uniformly divided.
The vernier caliper is a more precise measuring device than is the meter stick. It consists of a fixed jaw and
a sliding jaw which slides along a metric scale graduated in millimeters (mm). Reading the vernier is very
simple. Notice that when the jaws are completely closed, the first division to the left on the movable jaw is at
the zero point on the fixed scale. The left-most or zero graduation of the movable scale will be used for
reading the measurement on the fixed scale. The distance to the nearest millimeter is read from the fixed
scale; the tenth of millimeter to be added is determined by which division mark on the sliding scale coincides
with a division on the fixed scale. Thus the distance is measured to a tenth of a millimeter.
Best use of any instrument is to read the scales as precisely as possible. Estimates of fraction of a division
can be used with both of the above instruments. Typically, for the meter stick, one can estimate to about
one-third of a division. For the vernier caliper, estimation is more difficult, but occasionally one can
estimate to one-half of the moving scale division.
Procedure:/nProcedure:
1. Sign onto the laboratory laptop, and download the spreadsheet from Canvas.
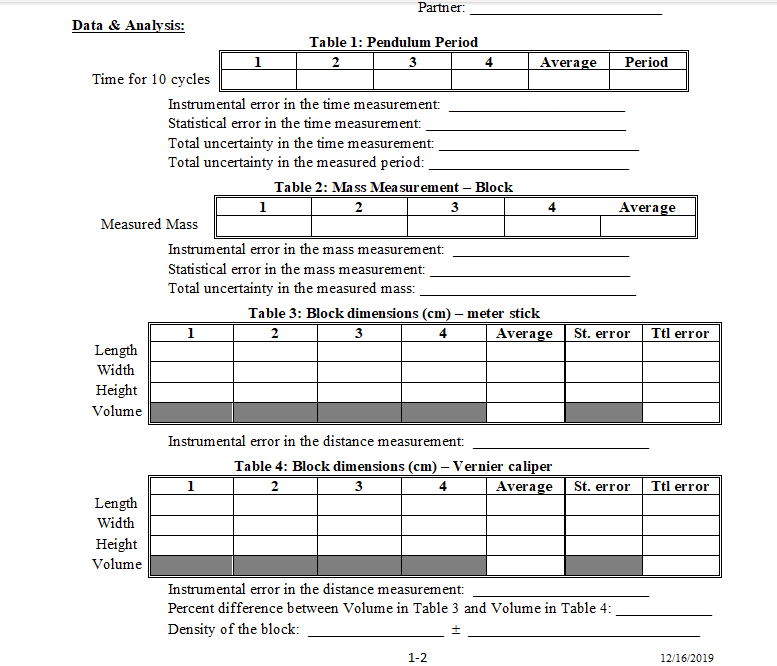
2. Each person in the team will use the online stopwatch to measure the time interval for 10 complete
oscillations (cycles) of the pendulum mounted on the lecture desk. Rotate through the team until four
times are recorded. The stopwatch measures to the one-thousandth of second; record the data in Table 1.
Although the stopwatch records time to the thousandth of second, note that the instrumental uncertainty
is recorded as 0.2 s. This value for the error reflects the visual reaction time in starting and stopping the
timer. The spreadsheet calculates the average of the times, and divides by 10 to compute the period.
Note that the instrumental uncertainty is included in the worksheet. The spreadsheet computes the
statistical error and the total error in the average, as well as the error in the period.
3. Each person in the team will use the triple-beam balance to measure the mass of the wooden block.
Enter the results in Table 2; there should be at least one entry for each member of the team. Note that the
instrumental uncertainty is 0.05.g. The spreadsheet computes the average mass of the block, as well as
the statistical and total errors.
1-1
12/16/2019/n4. Each person in the team will use the meter stick or ruler to measure the dimensions of the block
provided. Express your results using the unit centimeter (cm). Rotate through the team until four data
sets are recorded in Table 3. Note that the instrumental uncertainty is 0.05 cm. For each dimension, the
spreadsheet computes the average distance, and the statistical, and total errors. Use the error propagation
software to compute the volume and its error.
5. Each person in the team will use the vernier caliper to measure the dimensions of the block. Rotate
through the team until four data sets are recorded. Record the data in Table 4. Note that the instrumental
error is 0.005 cm. For each dimension, the spreadsheet computes the average, the statistical uncertainty.
and the total uncertainty. The volume of the block and its error is also computed.
6. The spreadsheet computes the percent difference for the volumes found in steps 3 and 4. [See the
Reference Section on Measurement and Its Uncertainty.]
7. Use the error propagation software to compute the density of the block and its error, using the mass from
Table 2 and the volume from Table 4.
Partner:
Doto & Angliciou
Partner:
Partner:/nData & Analysis:
Time for 10 cycles
Measured Mass
Length
Width
Height
Volume
Length
Width
Height
Volume
Instrumental error in the time measurement:
Statistical error in the time measurement:
Total uncertainty in the time measurement:
Total uncertainty in the measured period:
1
Partner:
Table 1: Pendulum Period
3
2
1
Instrumental error in the mass measurement:
Statistical error in the mass measurement:
Total uncertainty in the measured mass:
1
Table 2: Mass Measurement - Block
2
3
Instrumental error in the distance measurement:
4
Average Period
Table 3: Block dimensions (cm) - meter stick
2
3
Average
1-2
4
Table 4: Block dimensions (cm) - Vernier caliper
2
3
4
Average
Average
St. error
Instrumental error in the distance measurement:
Percent difference between Volume in Table 3 and Volume in Table 4:
Density of the block:
±
St. error
Ttl error
Ttl error
12/16/2019/nSummary and Conclusions
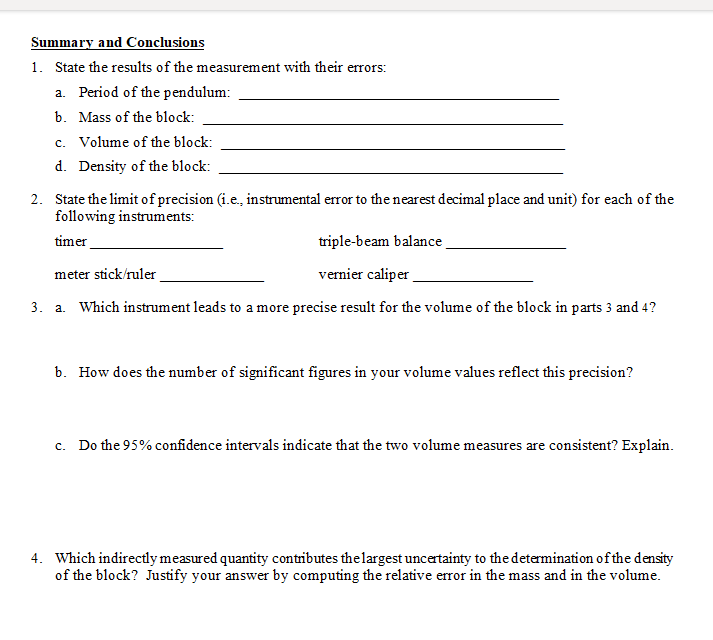
1. State the results of the measurement with their errors:
a. Period of the pendulum:
b. Mass of the block:
c. Volume of the block:
d. Density of the block:
2. State the limit of precision (i.e., instrumental error to the nearest decimal place and unit) for each of the
following instruments:
timer
triple-beam balance
vernier caliper
meter stick/ruler
3. a. Which instrument leads to a more precise result for the volume of the block in parts 3 and 4?
b. How does the number of significant figures in your volume values reflect this precision?
c. Do the 95% confidence intervals indicate that the two volume measures are consistent? Explain.
4. Which indirectly measured quantity contributes the largest uncertainty to the determination of the density
of the block? Justify your answer by computing the relative error in the mass and in the volume./n5. Other than the instrumental error of the timer, name a specific factor that limits the precision of the
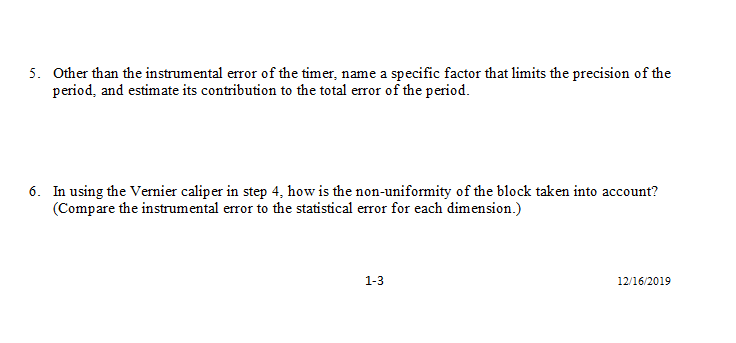
period, and estimate its contribution to the total error of the period.
6. In using the Vernier caliper in step 4, how is the non-uniformity of the block taken into account?
(Compare the instrumental error to the statistical error for each dimension.)
1-3
12/16/2019