Group Activity-Sections 3.3: Measures of Center & Section 3.4: Measures of Variation/Spread
2. Measures of Center (Mean, Median, Mode, Shape)
Measures of Variation/Spread (5-Number Summary, IQR, Standard Deviation) & Boxplot
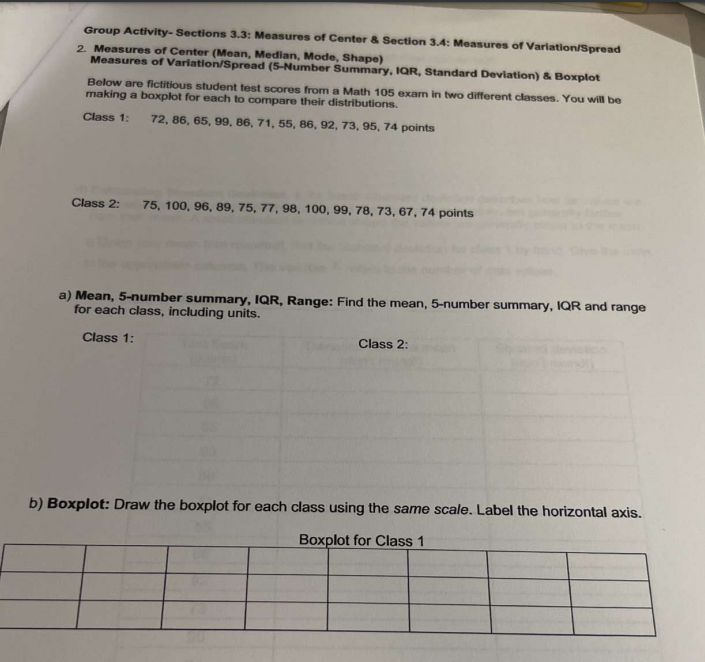
Below are fictitious student test scores from a Math 105 exam in two different classes. You will be
making a boxplot for each to compare their distributions.
Class 1: 72, 86, 65, 99, 86, 71, 55, 86, 92, 73, 95, 74 points
Class 2: 75, 100, 96, 89, 75, 77, 98, 100, 99, 78, 73, 67, 74 points
a) Mean, 5-number summary, IQR, Range: Find the mean, 5-number summary, IQR and range
for each class, including units.
Class 1:
Class 2:
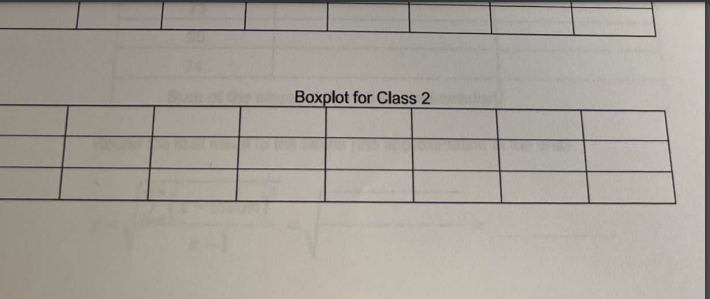
b) Boxplot: Draw the boxplot for each class using the same scale. Label the horizontal axis.
Boxplot for Class 1/nBoxplot for Class 2/nnolais
Group Activity- Sections 3.3: Measures of Center & Section 3.4: Measures of Variation/Spread
c) Shape: What is the shape of the data for each class? How can you tell?
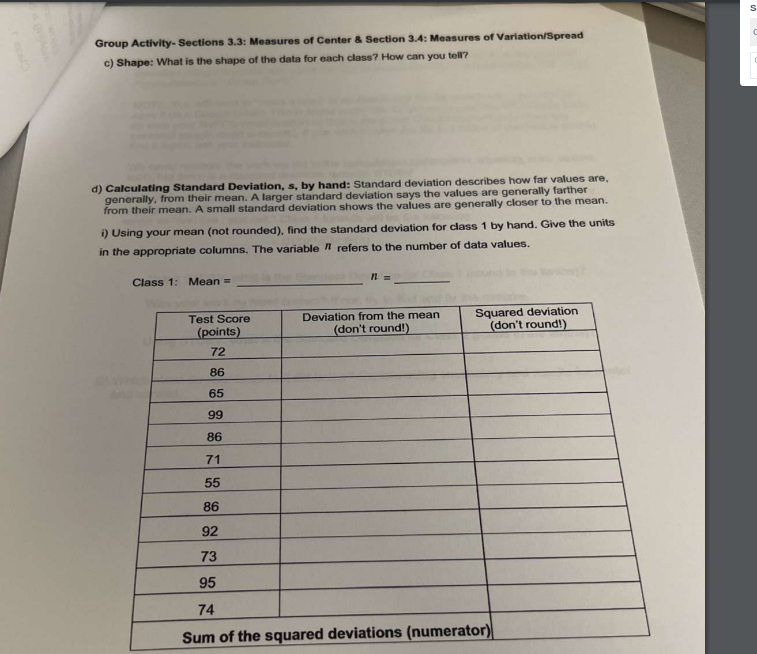
d) Calculating Standard Deviation, s, by hand: Standard deviation describes how far values are,
generally, from their mean. A larger standard deviation says the values are generally farther
from their mean. A small standard deviation shows the values are generally closer to the mean.
i) Using your mean (not rounded), find the standard deviation for class 1 by hand. Give the units
in the appropriate columns. The variable refers to the number of data values.
Class 1: Mean =
Test Score
(points)
72
86
65
99
86
71
55
86
92
73
n =
Deviation from the mean
(don't round!)
Squared deviation
(don't round!)
95
74
Sum of the squared deviations (numerator)
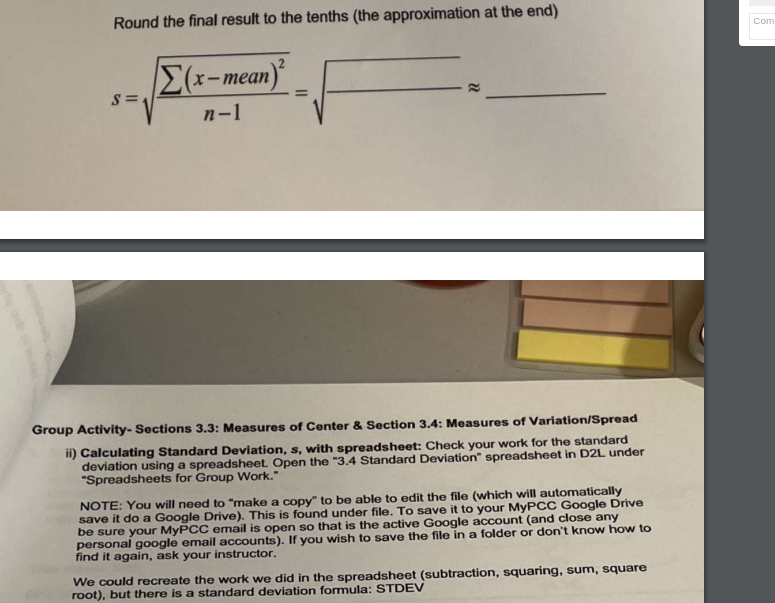
S/nRound the final result to the tenths (the approximation at the end)
Σ(x-mean)
n-1
S=
=
Group Activity- Sections 3.3: Measures of Center & Section 3.4: Measures of Variation/Spread
ii) Calculating Standard Deviation, s, with spreadsheet: Check your work for the standard
deviation using a spreadsheet. Open the "3.4 Standard Deviation spreadsheet in D2L under
"Spreadsheets for Group Work."
NOTE: You will need to "make a copy" to be able to edit the file (which will automatically
save it do a Google Drive). This is found under file. To save it to your MyPCC Google Drive
be sure your MyPCC email is open so that is the active Google account (and close any
personal google email accounts). If you wish to save the file in a folder or don't know how to
find it again, ask your instructor.
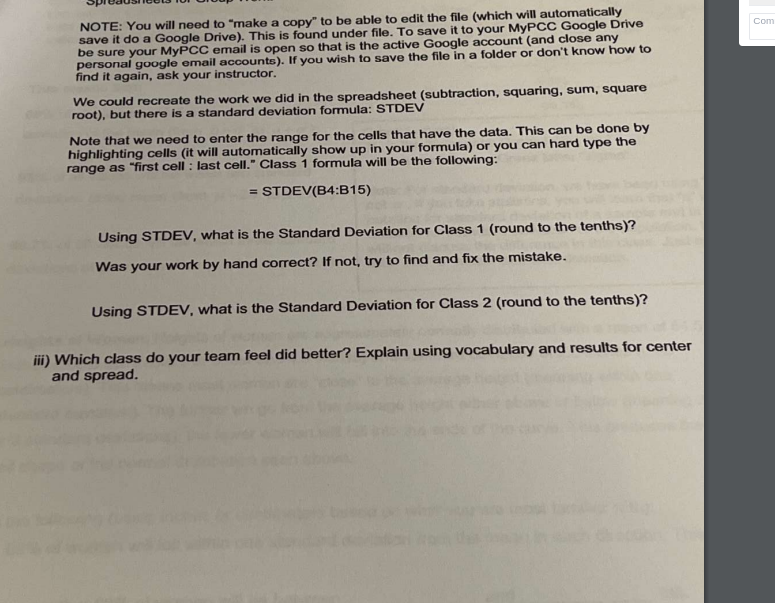
We could recreate the work we did in the spreadsheet (subtraction, squaring, sum, square
root), but there is a standard deviation formula: STDEV
Com/nNOTE: You will need to "make a copy" to be able to edit the file (which will automatically
save it do a Google Drive). This is found under file. To save it to your MyPCC Google Drive
be sure your MyPCC email is open so that is the active Google account (and close any
personal google email accounts). If you wish to save the file in a folder or don't know how to
find it again, ask your instructor.
We could recreate the work we did in the spreadsheet (subtraction, squaring, sum, square
root), but there is a standard deviation formula: STDEV
Note that we need to enter the range for the cells that have the data. This can be done by
highlighting cells (it will automatically show up in your formula) or you can hard type the
range as "first cell: last cell." Class 1 formula will be the following:
= STDEV(B4:B15)
Using STDEV, what is the Standard Deviation for Class 1 (round to the tenths)?
Was your work by hand correct? If not, try to find and fix the mistake.
Using STDEV, what is the Standard Deviation for Class 2 (round to the tenths)?
iii) Which class do your team feel did better? Explain using vocabulary and results for center
and spread.
Com