I.
II.
III.
Part I:
Objectives:
After completing this lab experiment, you should be able to:
• Measure the resistance and capacitance.
• Familiarize with Oscilloscope and Function generator.
• Measure the RC time constant using VR and Vc.
Understand the effect of series and parallel capacitors on RC time constant.
Parts List:
• Resistor (1) 1 k
Electric Circuits Lab
Capacitors in DC Circuits
Capacitors (2) 0.22 μF
Procedures:
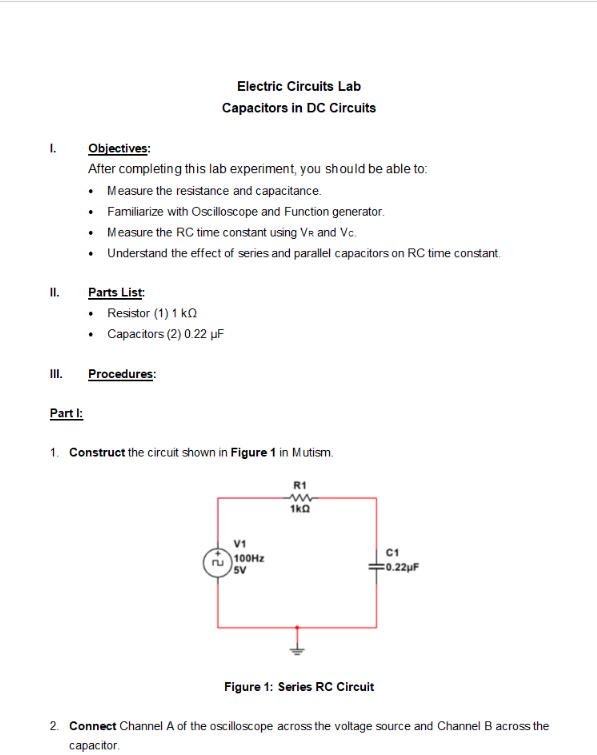
1. Construct the circuit shown in Figure 1 in Mutism.
ru
V1
100Hz
5V
R1
m
1kQ
Figure 1: Series RC Circuit
C1
0.22μF
2. Connect Channel A of the oscilloscope across the voltage source and Channel B across the
capacitor./n3. Set the function generator to 5V ppi 100 Hz, Square Wave 50% duty cycle with 2.5 DC offset
if using a function generator. If using clock voltage, set it to 5Vpp, 100 Hz. The DC offset can
be modeled by using DC mode on the oscilloscope.
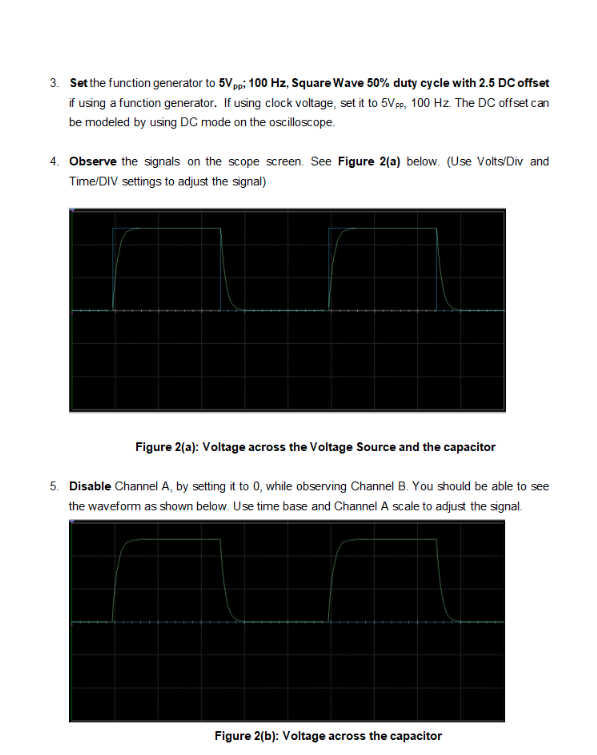
4. Observe the signals on the scope screen. See Figure 2(a) below. (Use Volts/Div and
Time/DIV settings to adjust the signal)
Figure 2(a): Voltage across the Voltage Source and the capacitor
5. Disable Channel A, by setting it to 0, while observing Channel B. You should be able to see
the waveform as shown below. Use time base and Channel A scale to adjust the signal.
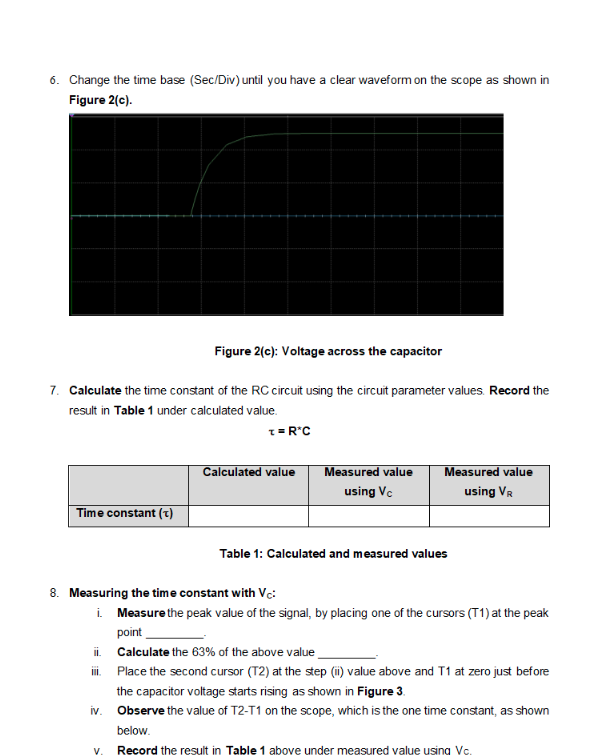
Figure 2(b): Voltage across the capacitor/n6. Change the time base (Sec/Div) until you have a clear waveform on the scope as shown in
Figure 2(c).
7. Calculate the time constant of the RC circuit using the circuit parameter values. Record the
result in Table 1 under calculated value.
T=R*C
Time constant (t)
Figure 2(c): Voltage across the capacitor
Calculated value
8. Measuring the time constant with Vc:
V.
Measured value
using Vc
Measured value
using VR
Table 1: Calculated and measured values
i. Measure the peak value of the signal, by placing one of the cursors (T1) at the peak
point
ii. Calculate the 63% of the above value
III.
Place the second cursor (T2) at the step (ii) value above and T1 at zero just before
the capacitor voltage starts rising as shown in Figure 3.
iv. Observe the value of T2-T1 on the scope, which is the one time constant, as shown
below.
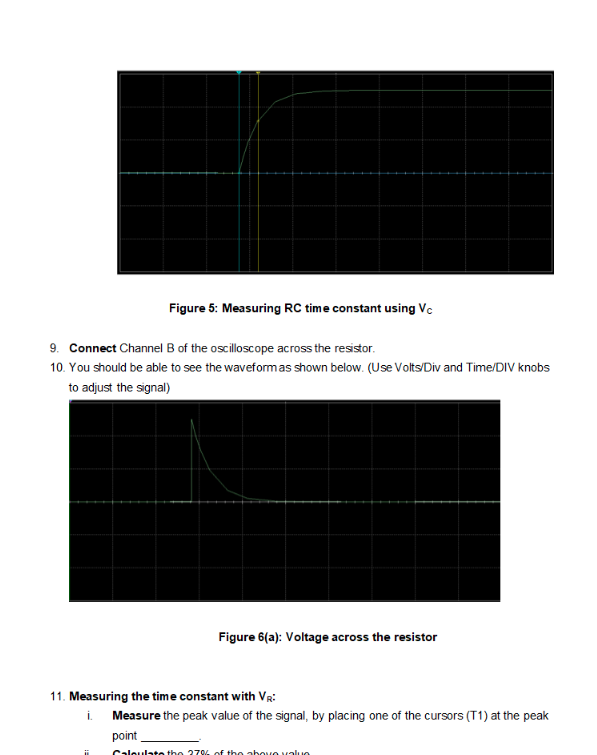
Record the result in Table 1 above under measured value using Vc./nFigure 5: Measuring RC time constant using Vc
9. Connect Channel B of the oscilloscope across the resistor.
10. You should be able to see the waveform as shown below. (Use Volts/Div and Time/DIV knobs
to adjust the signal)
Figure 6(a): Voltage across the resistor
11. Measuring the time constant with VR:
i.
Measure the peak value of the signal, by placing one of the cursors (T1) at the peak
point
Calculate the 27% of the above value/niv.
V.
Part II:
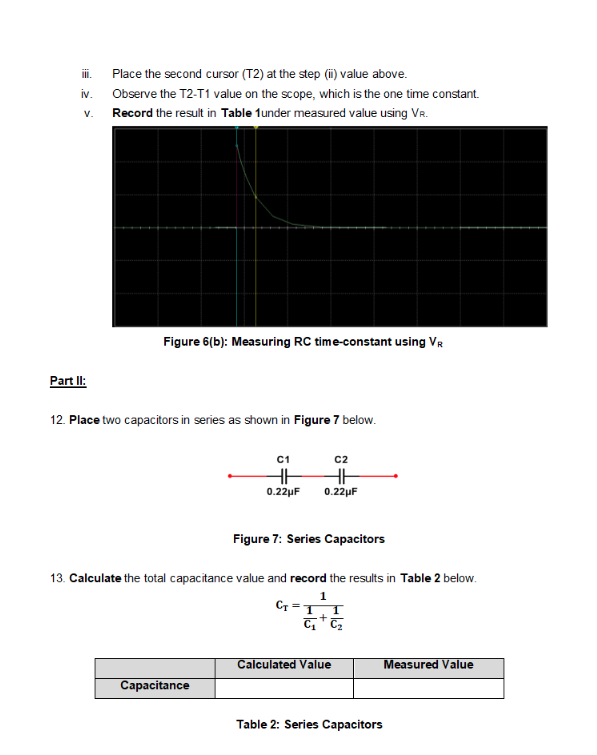
Place the second cursor (T2) at the step (ii) value above.
Observe the T2-T1 value on the scope, which is the one time constant.
Record the result in Table 1 under measured value using VR.
Figure 6(b): Measuring RC time-constant using VR
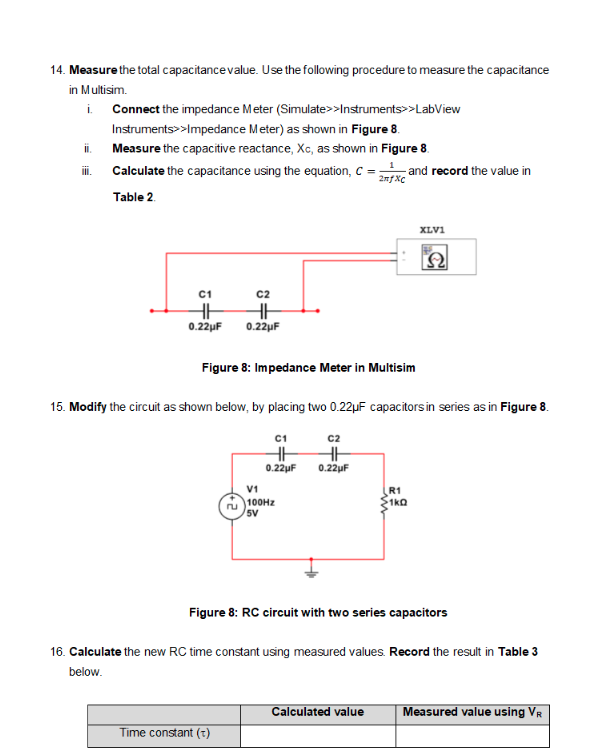
12. Place two capacitors in series as shown in Figure 7 below.
C₁1
HH
0.22μF
Capacitance
C2
HH
0.22μF
13. Calculate the total capacitance value and record the results in Table 2 below.
1
G=1 +4₂
Figure 7: Series Capacitors
Calculated Value
Table 2: Series Capacitors
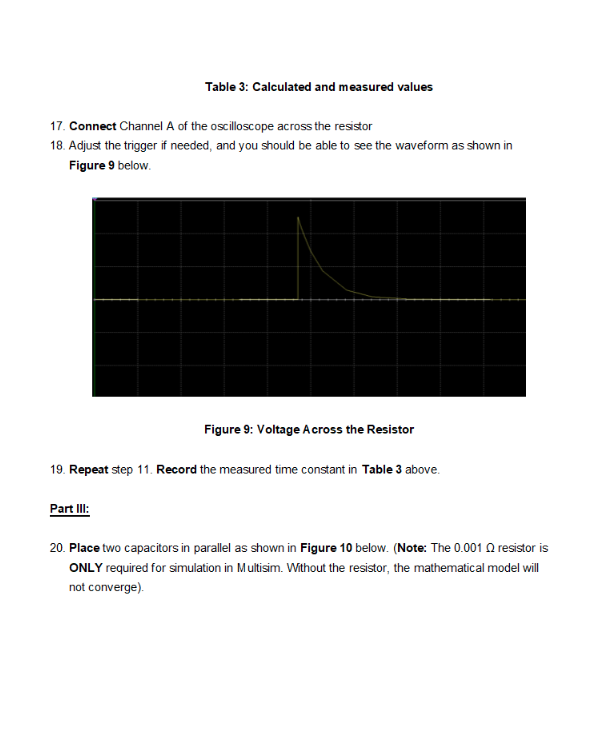
Measured Value/n14. Measure the total capacitance value. Use the following procedure to measure the capacitance
in Multisim.
i.
ii.
iii.
Connect the impedance Meter (Simulate>>Instruments>>LabView
Instruments>>Impedance Meter) as shown in Figure 8.
Measure the capacitive reactance, Xc, as shown in Figure 8.
Calculate the capacitance using the equation, C = and record the value in
2nJXc
Table 2.
C1
HH
0.22μF
C2
HH
0.22μF
Figure 8: Impedance Meter in Multisim
15. Modify the circuit as shown below, by placing two 0.22μF capacitors in series as in Figure 8.
C1
HH
0.22μF
Time constant (t)
V1
100Hz
5V
C2
HH
0.22μF
XLVI
R1
>1kQ
Ω
Figure 8: RC circuit with two series capacitors
Calculated value
16. Calculate the new RC time constant using measured values. Record the result in Table 3
below.
Measured value using VR/nTable 3: Calculated and measured values
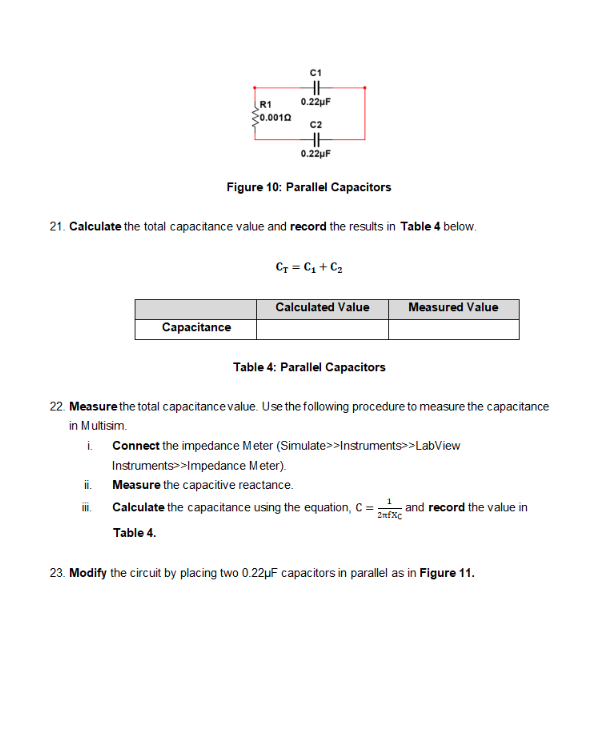
17. Connect Channel A of the oscilloscope across the resistor
18. Adjust the trigger if needed, and you should be able to see the waveform as shown in
Figure 9 below.
Part III:
Figure 9: Voltage Across the Resistor
19. Repeat step 11. Record the measured time constant in Table 3 above.
20. Place two capacitors in parallel as shown in Figure 10 below. (Note: The 0.001 resistor is
ONLY required for simulation in Multisim. Without the resistor, the mathematical model will
not converge)./nii.
R1
20.0010
III.
C1
HH
0.22μF
21. Calculate the total capacitance value and record the results in Table 4 below.
Capacitance
C2
HH
0.22μF
Figure 10: Parallel Capacitors
CT = C₁ + C₂
Calculated Value
Table 4: Parallel Capacitors
22. Measure the total capacitance value. Use the following procedure to measure the capacitance
in Multisim.
i.
Measured Value
Connect the impedance Meter (Simulate>>Instruments>>LabView
Instruments>>Impedance Meter).
Measure the capacitive reactance.
Calculate the capacitance using the equation, C =
Table 4.
1
2mfXc
and record the value in
23. Modify the circuit by placing two 0.22μF capacitors in parallel as in Figure 11./nV1
100Hz
SV
5
HH
0.22μF
C2
HH
0.22μF
R2
1kQ
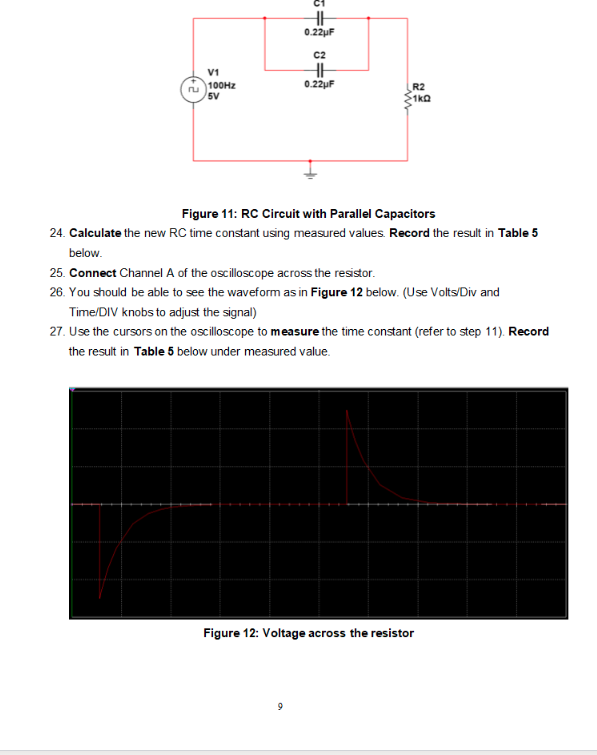
Figure 11: RC Circuit with Parallel Capacitors
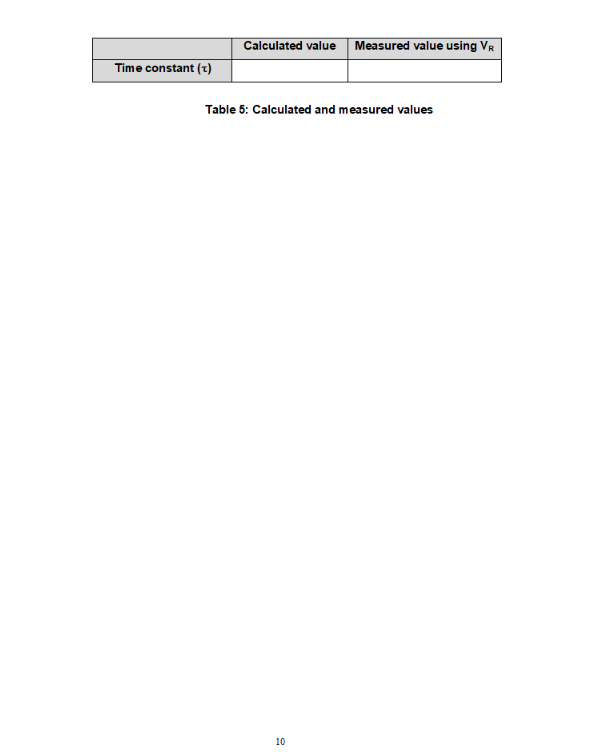
24. Calculate the new RC time constant using measured values. Record the result in Table 5
below.
25. Connect Channel A of the oscilloscope across the resistor.
26. You should be able to see the waveform as in Figure 12 below. (Use Volts/Div and
Time/DIV knobs to adjust the signal)
27. Use the cursors on the oscilloscope to measure the time constant (refer to step 11). Record
the result in Table 5 below under measured value.
Figure 12: Voltage across the resistor/nTime constant (t)
Calculated value Measured value using VR
Table 5: Calculated and measured values
10