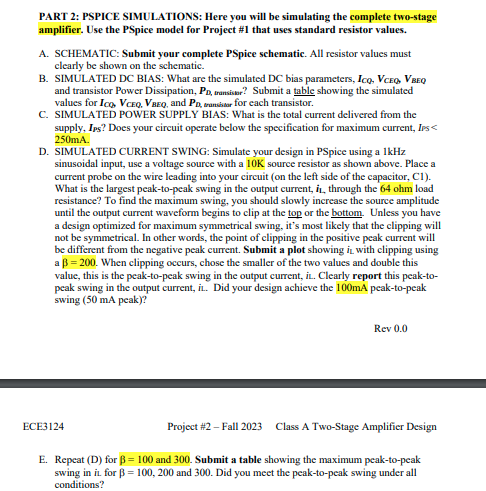
PART 2: PSPICE SIMULATIONS: Here you will be simulating the complete two-stage
amplifier. Use the PSpice model for Project #1 that uses standard resistor values.
A. SCHEMATIC: Submit your complete PSpice schematic. All resistor values must
clearly be shown on the schematic.
B. SIMULATED DC BIAS: What are the simulated DC bias parameters, ICQ, VCEO, VBEQ
and transistor Power Dissipation, PD, transistor? Submit a table showing the simulated
values for ICQ, VCEQ, VBEQ, and PD, transistor for each transistor.
C. SIMULATED POWER SUPPLY BIAS: What is the total current delivered from the
supply, Ips? Does your circuit operate below the specification for maximum current, IPS<
250mA.
D. SIMULATED CURRENT SWING: Simulate your design in PSpice using a 1kHz
sinusoidal input, use a voltage source with a 10K source resistor as shown above. Place a
current probe on the wire leading into your circuit (on the left side of the capacitor, C1).
What is the largest peak-to-peak swing in the output current, it, through the 64 ohm load
resistance? To find the maximum swing, you should slowly increase the source amplitude
until the output current waveform begins to clip at the top or the bottom. Unless you have
a design optimized for maximum symmetrical swing, it's most likely that the clipping will
not be symmetrical. In other words, the point of clipping in the positive peak current will
be different from the negative peak current. Submit a plot showing it with clipping using
a ß = 200. When clipping occurs, chose the smaller of the two values and double this
value, this is the peak-to-peak swing in the output current, iL. Clearly report this peak-to-
peak swing in the output current, i. Did your design achieve the 100mA peak-to-peak
swing (50 mA peak)?
ECE3124
Class A Two-Stage Amplifier Design
E. Repeat (D) for B= 100 and 300. Submit a table showing the maximum peak-to-peak
swing in it for B = 100, 200 and 300. Did you meet the peak-to-peak swing under all
conditions?
Rev 0.0
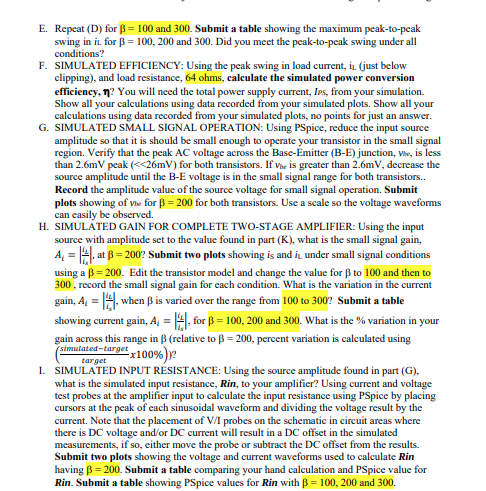
Project #2 - Fall 2023/nE. Repeat (D) for B = 100 and 300. Submit a table showing the maximum peak-to-peak
swing in it for ß = 100, 200 and 300. Did you meet the peak-to-peak swing under all
conditions?
F. SIMULATED EFFICIENCY: Using the peak swing in load current, it (just below
clipping), and load resistance, 64 ohms, calculate the simulated power conversion
efficiency, n? You will need the total power supply current, IPS, from your simulation.
Show all your calculations using data recorded from your simulated plots. Show all your
calculations using data recorded from your simulated plots, no points for just an answer.
G. SIMULATED SMALL SIGNAL OPERATION: Using PSpice, reduce the input source
amplitude so that it is should be small enough to operate your transistor in the small signal
region. Verify that the peak AC voltage across the Base-Emitter (B-E) junction, vie, is less
than 2.6mV peak (<<26mV) for both transistors. If Vie is greater than 2.6mV, decrease the
source amplitude until the B-E voltage is in the small signal range for both transistors..
Record the amplitude value of the source voltage for small signal operation. Submit
plots showing of vie for ß = 200 for both transistors. Use a scale so the voltage waveforms
can easily be observed.
H. SIMULATED GAIN FOR COMPLETE TWO-STAGE AMPLIFIER: Using the input
source with amplitude set to the value found in part (K), what is the small signal gain,
A₁ =, at B= 200? Submit two plots showing is and it under small signal conditions
using a B= 200. Edit the transistor model and change the value for ẞ to 100 and then to
300, record the small signal gain for each condition. What is the variation in the current
gain, A₁ = when ß is varied over the range from 100 to 300? Submit a table
showing current gain, A₁ = 4, for ß = 100, 200 and 300. What is the % variation in your
gain across this range in ß (relative to ß = 200, percent variation is calculated using
(simulated-target x100%))?
target
I. SIMULATED INPUT RESISTANCE: Using the source amplitude found in part (G),
what is the simulated input resistance, Rin, to your amplifier? Using current and voltage
test probes at the amplifier input to calculate the input resistance using PSpice by placing
cursors at the peak of each sinusoidal waveform and dividing the voltage result by the
current. Note that the placement of V/I probes on the schematic in circuit areas where
there is DC voltage and/or DC current will result in a DC offset in the simulated
measurements, if so, either move the probe or subtract the DC offset from the results.
Submit two plots showing the voltage and current waveforms used to calculate Rin
having ß = 200. Submit a table comparing your hand calculation and PSpice value for
Rin. Submit a table showing PSpice values for Rin with ß= 100, 200 and 300.