PH211 Lab 3 - Uncertainty
PH211 - General Physics with Calculus
Uncertainty refers to limitations on our ability to make accurate measurements due to equipment
and experimental design. This lab will investigate why we have uncertainty and how uncertainty
in measurements leads to uncertainty in results.
Learning Objectives
After successful completion of this lab assignment, you should be able to
1. Collect data from the experiment.
2. Analyze data using linearization.
3. Include uncertainty in both data and results.
4. Make sense of data analysis using proportional reasoning and sensemaking techniques.
5. Determine the range of conclusions including uncertainty.
Equipment Provided
For this lab, you will have access to:
1. An inclined metal ramp
2. A metal ball
3. Landing Pad
4. Meter stick
5. Measuring tape
6. Stopwatch
7. Calipers
Part 1: Making Measurements
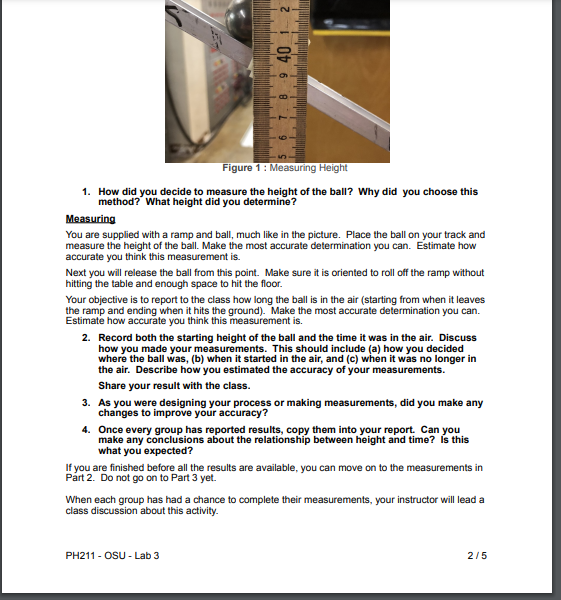
Consider the image given below in Figure 1. It is a picture of a metal ball just before it is rolled
Need to make a lab report in 3 pages | Use simple language/nPart 1: Making Measurements
Consider the image given below in Figure 1. It is a picture of a metal ball just before it is rolled
down a ramp.
Discuss with your lab partners how each of you would determine the height of this ball. Come to
a consensus on how you should do this. Your goal is not to determine a value for the height yet,
but to describe the criteria you should use to determine what the height is. Included in this, de-
scribe where on the ball you would measure heights.
After your discussion, use your criteria to determine the height of the ball in the picture.
PH211 - OSU - Lab 3
Am
3
2
1.
9 40
8
Need to make a lab report in 3 pages | Use simple language
Jual..
1/5/nN
40
Figure 1: Measuring Height
1. How did you decide to measure the height of the ball? Why did you choose this
method? What height did you determine?
Measuring
You are supplied with a ramp and ball, much like in the picture. Place the ball on your track and
measure the height of the ball. Make the most accurate determination you can. Estimate how
accurate you think this measurement is.
Next you will release the ball from this point. Make sure it is oriented to roll off the ramp without
hitting the table and enough space to hit the floor.
Your objective is to report to the class how long the ball is in the air (starting from when it leaves
the ramp and ending when it hits the ground). Make the most accurate determination you can.
Estimate how accurate you think this measurement is.
2. Record both the starting height of the ball and the time it was in the air. Discuss
how you made your measurements. This should include (a) how you decided
where the ball was, (b) when it started in the air, and (c) when it was no longer in
the air. Describe how you estimated the accuracy of your measurements.
Share your result with the class.
3. As you were designing your process or making measurements, did you make any
changes to improve your accuracy?
4.
Once every group has reported results, copy them into your report. Can you
make any conclusions about the relationship between height and time? Is this
what you expected?
If you are finished before all the results are available, you can move on to the measurements in
Part 2. Do not go on to Part 3 yet.
PH211-OSU - Lab 3
When each group has had a chance to complete their measurements, your instructor will lead a
class discussion about this activity.
2/5/nacknowledgement
Uncertainty is the
that we cannot measure things exactly, and so any
conclusion based on measurements will always include a range of possible answers.
When including uncertainty in a value, we report it as A ± AA. We believe the value is A,
but we're unable to rule out the possibility that it's higher or lower by an amount AA. (Some-
times it's written +A1 /-A2 if the higher and lower ranges are different.) For example, a time
might be reported as 2.45 s + 0.03 s.
Uncertainty is not the same as "human error." Human error implies you made a mistake
doing the experiment but didn't try to fix it. That's not good. If you make any mistakes, fix
them! This includes making mistakes in calculations. "We might have calculated the answer
incorrectly" is not a source of uncertainty.
"Human error" should never be included as a source of uncertainty. It is not some
thing you are uncertain of; it is something you did wrong.
Part 2: Minimizing Uncertainty
Next, everyone in the class will measure the same object to investigate how the method of
measurement affects the uncertainty, and what happens when multiple measurements are com-
bined.
At the front of the room is a large, rectangular object. Each member of the group should indi-
vidually determine the length (L), width (M), and height (H) of the object as accurately as you
can with the indicated equipment. We will define length as the longest dimension and height as
the smallest dimension.
Determine the values twice.
a) The first time you should use just the meter stick
b) The second time you can use any of the measuring devices you're given.
In each case, estimate the uncertainty in each of your measurements.
4. Record a final, best value for each measurement in each case
using the standard AA ± format. Include the person who
took the measurements. Each group member should report a
total of six values.
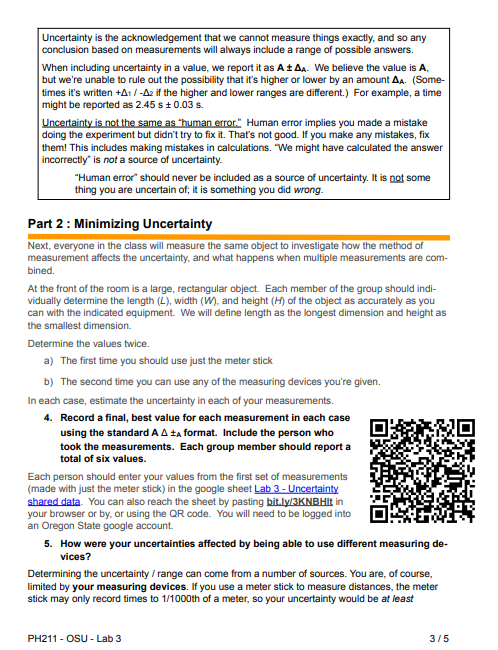
Each person should enter your values from the first set of measurements
(made with just the meter stick) in the google sheet Lab 3 - Uncertainty
shared data. You can also reach the sheet by pasting bit.ly/3KNBHlt in
your browser or by, or using the QR code. You will need to be logged into
an Oregon State google account.
5. How were your uncertainties affected by being able to use different measuring de-
vices?
Determining the uncertainty / range can come from a number of sources. You are, of course,
limited by your measuring devices. If you use a meter stick to measure distances, the meter
stick may only record times to 1/1000th of a meter, so your uncertainty would be at least
PH211 - OSU-Lab 3
3/5/n0.001m. There is always an uncertainty associated with your experimental tools. You can try to
choose tools that minimize uncertainty, but you may not have this option. It's still important to
understand how much uncertainty your tools introduce.
Your experimental design can also add to your uncertainty by the measurement method you
choose. For example, how did you move the meter stick when measuring distances greater
than a meter? In cases like these, you may need to make an estimate of the uncertainty intro-
duced by your methods.
You can often minimize these uncertainties by careful experimental design. For example, you
could use something other than a meter stick to measure distance (as you did in the second set
of measurements). You might take a picture of the measurement that you could magnify, or use
a lens to magnify your view.
It's important to realize that because you can eliminate or reduce these uncertainties, they are
not "human error". They are a result of the design of your experiment. Human error should be
avoided and very rarely a part of your final uncertainty.
Part 3: Combining Results
As a group, determine a way to combine the measurements you each took individually into a
single value for the group. Don't worry about combining the uncertainties, just the values.
6. Report the two "combined" values, one using the meter stick and one using the
other equipment. Do you feel this value is a better estimate of the length? Why or
why not?
Once everyone in the class has recorded their measured values in the google sheet, take
screenshots of the histograms showing the accumulated class results.
7. Add the screenshot to your report (after cropping to include just the graphs). Use
the graphs to estimate the value and uncertainty of each dimension. Discuss how
you came to these results.
8. Report the average value for each measurement, given at the bottom of the data
columns. Compare them to the values for your group as well as the values you
got from the graphs. Which method do you feel gives the most accurate estimate
of each dimension? Why?
Recording multiple trials can help limit some forms of uncertainty. Averaging the different re-
sults for one data point reduces random uncertainty and gives a more accurate answer. Multi-
ple trials also allow you to make a judgment about the uncertainty.¹
Part 4: How Uncertainty Affects Your Results
Here we want to consider how uncertainty in the measurements might affect results that depend
on those measurements. We will use the three values for the dimension of the object you just
measured to calculate its volume. Recall that the volume V = L x WxD.
1 You can read more about uncertainty in the Lab Guidance for Students.
PH211 - OSU-Lab 3
4/5/nThe volume depends on three measurements whose values we do not know exactly. Before
calculating the volume, discuss with your group how the uncertainty in each measurement will
affect the accuracy of your calculation. In particular, come up with a method for quantitatively
estimating the uncertainty in the volume. Finding the uncertainty in a calculated value from un-
certainties in the underlying measurements is sometimes called propagation of uncertainty, or
the less preferred propagation of error.
9. Describe the method your group develops, including your reasoning. Then use it
to determine a best estimate for the volume of the object and the uncertainty in
the estimate. Report your value using the standard A A ±A format.
Part 5: Reflect and Conclude
This activity is meant to show how limitations on how well we can measure things creates a lev-
el of uncertainty in our results.
10. Each member of the group should describe a situation in which uncertainty in a
measurement made it difficult for you to reach a conclusion. Label each entry
with the name of the group member.
Part 6: Submit Your Group's Lab Report
Make sure everyone's name is on your group's lab report. If you submit through Gradescope
remember to add everyone in your group to the assignment. This is done at the end of the
submission process.