Prelab Part 1
In Lab 2, we built a simple volt meter using a d'Arsonval panel meter. We found that the main
problem with this simple meter is that its Thevenin resistance is rather small. Because of this, it
tends to load the circuit being measured, changing the value of the voltage to be measured.
Here, we consider an improved volt meter that uses a 1 mA d'Arsonval panel meter and an op
amp as shown in Figure 1. In this figure, assume power rails of +7 V, and -2 V.
a) Calculate the value of R required so that i₁ = 1 mA when v₁ = 5 V.
b) For the value of R calculated above, write an expression for id as a function of vi.
Observe that your equation in b) results in a linearly increasing needle deflection as a function
of v₁, with full (100%) deflection at 5 V. Specifically, the current through the panel meter is of
the form id = ẞvi. That is, the op amp and resistor form a voltage-controlled current source
with the panel meter as its load. An important feature of this circuit is that neither the value
that you calculated for R, nor your equation for ia depend on the internal resistance of the
panel meter.
vi.
w
R
Figure 1. Improved volt meter.
In Lab 2, we used your simple meter to measure the voltage at terminals a and b in Figure 2
below. We discovered that your meter performed poorly when RT was not small. Specifically,
we saw a large %error for the case of RT = 4.7 kn. This is because the input (Thevenin)
resistance of your meter was not very large compared to 4.7 kn./nRecall that an ideal volt meter has infinite input resistance. The input resistance looking into the
input of the improved volt meter of Figure 1 is very large. In class, we would model it as infinity.
In reality, it is "only" many Meg-Ohms. This results in the %error of the improved meter being
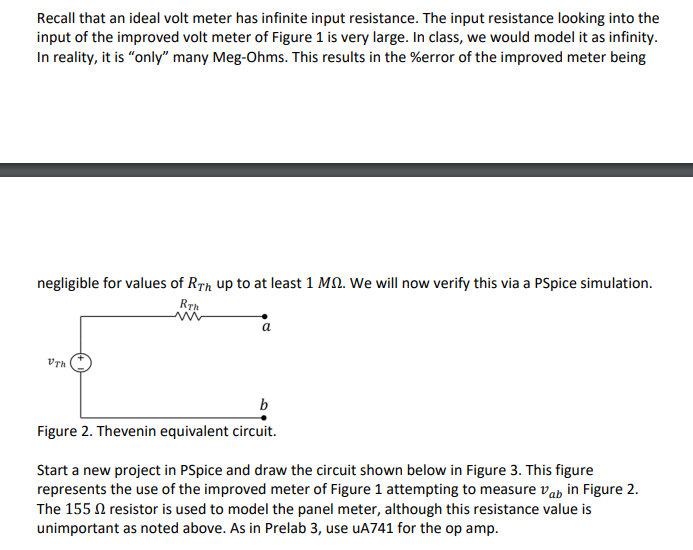
negligible for values of RTh up to at least 1 MQ. We will now verify this via a PSpice simulation.
RTh
w
a
VTh
b
Figure 2. Thevenin equivalent circuit.
Start a new project in PSpice and draw the circuit shown below in Figure 3. This figure
represents the use of the improved meter of Figure 1 attempting to measure vab in Figure 2.
The 155 resistor is used to model the panel meter, although this resistance value is
unimportant as noted above. As in Prelab 3, use uA741 for the op amp./nStart a new project in PSpice and draw the circuit shown below in Figure 3. This figure
represents the use of the improved meter of Figure 1 attempting to measure vab in Figure 2.
The 155 resistor is used to model the panel meter, although this resistance value is
unimportant as noted above. As in Prelab 3, use uA741 for the op amp.
We have not used the Vcc labeling trick this time, and have just allowed wires to cross. Note
carefully that PSpice includes a red dot (node) where wires connect. There is no such
connection where the negative power supply wire crosses the feedback path. Note also, that
this time we have included two parameters (variables). Each of them is created using the new
property button in the property editor spreadsheet for the part PARAM, as before. You do not
need two copies of PARAM. You will just create two different properties (columns) within the
same instance of PARAM. Finally, note that the (default) values of the two parameters should
be chosen as vrh = 5 V and Rτh = 1 MQ. Remember that in PSpice, we use "meg" in place of
"M."
(VTh)
V2
PARAMETERS:
RTH=1 meg
VTh=5
R4
U17
www
3
V+
{RT}
082-46
6
OUT
2
OST40
UA741
V-
2
R2
www
R7
ww
155
Put your calculated
value of R here
No connection
here
www
w
R5
7k
R6
2k
V3
9Vdc/nPerform a linear sweep of RT from 1 k to 1 MQ in increments of 1 k. Note that Vrh will
(automatically) stay at its default value of 5 V throughout this sweep. Use a current marker, as
shown in Figure 3, to measure the current through the panel meter. The resulting graph will
show this current, id, as a function of RT. Ideally, it should be constant at 1 mA, corresponding
to 100% needle deflection, since the voltage that the meter is trying to measure is 5 V. In
reality, i will decrease very slightly as Rh increases due to the loading effect.
c) What value of RT (among those tested) yields the maximum error between id and its ideal
value of 1 mA?
d) For this value of RT, calculate the %error in id-
e) print your graph.
Now edit the simulation profile and redo the sweep. This time we will sweep vrh from 0 to 5 V
in increments of 0.1 V. The value of RT will (automatically) stay at its default value of 1 M
throughout the sweep. You may have to add the current marker again after you edit the
simulation profile. Ideally, the graph of the current through the panel meter, id, should rise
linearly from 0 to 1 mA, corresponding to a linear needle deflection from 0 to 100%. Your graph
should (essentially) show this desired behavior.
f) print your graph.