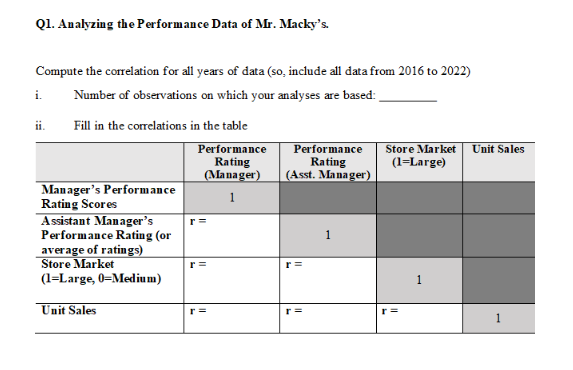
Q1. Analyzing the Performance Data of Mr. Macky's.
Compute the correlation for all years of data (so, include all data from 2016 to 2022)
Number of observations on which your analyses are based:
i.
ii.
Fill in the correlations in the table
Performance
Rating
(Manager)
1
Manager's Performance
Rating Scores
Assistant Manager's
Performance Rating (or
average of ratings)
Store Market
(1-Large, 0-Medium)
Unit Sales
r=
r=
r=
Performance
Rating
(Asst. Manager)
r=
r=
1
Store Market Unit Sales
(1=Large)
r=
1
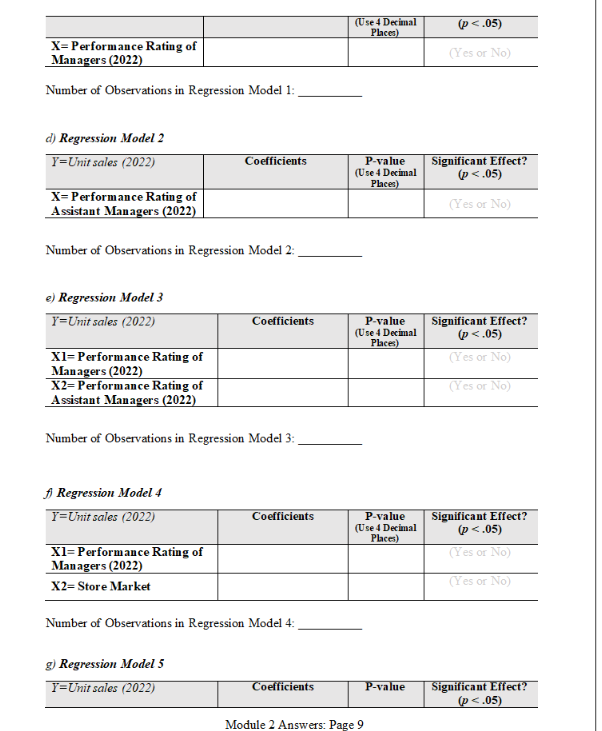
1/nX= Performance Rating of
Managers (2022)
Number of Observations in Regression Model 1:
d) Regression Model 2
Y=Unit sales (2022)
X= Performance Rating of
Assistant Managers (2022)
Number of Observations in Regression Model 2:
e) Regression Model 3
Y=Unit sales (2022)
X1= Performance Rating of
Managers (2022)
X2= Performance Rating of
Assistant Managers (2022)
f) Regression Model 4
Y=Unit sales (2022)
Coefficients
Number of Observations in Regression Model 3:
X1= Performance Rating of
Managers (2022)
X2= Store Market
Coefficients
g) Regression Model 5
Y=Unit sales (2022)
Coefficients
Number of Observations in Regression Model 4:
Coefficients
(Use 4 Decimal
Places)
P-value
(Use 4 Decimal
Places)
P-value
(Use 4 Decimal
Places)
P-value
(Use 4 Decimal
Places)
P-value
Module 2 Answers: Page 9
(p<.05)
(Yes or No)
Significant Effect?
(p<.05)
(Yes or No)
Significant Effect?
(p<.05)
(Yes or No)
(Yes or No)
Significant Effect?
(p<.05)
(Yes or No)
(Yes or No)
Significant Effect?
(p<.05)/nX1= Performance Rating of
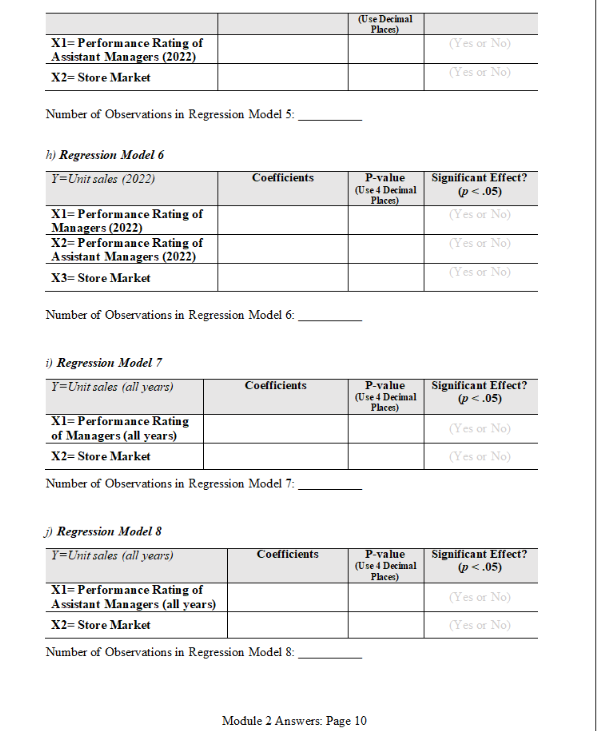
Assistant Managers (2022)
X2= Store Market
Number of Observations in Regression Model 5:
h) Regression Model 6
Y=Unit sales (2022)
X1= Performance Rating of
Managers (2022)
X2= Performance Rating of
Assistant Managers (2022)
X3= Store Market
Number of Observations in Regression Model 6:
i) Regression Model 7
Y=Unit sales (all years)
Coefficients
j) Regression Model 8
Y=Unit sales (all years)
Coefficients
X1= Performance Rating
of Managers (all years)
X2= Store Market
Number of Observations in Regression Model 7:
Coefficients
X1= Performance Rating of
Assistant Managers (all years)
X2= Store Market
Number of Observations in Regression Model 8:
(Use Decimal
Places)
P-value
(Use 4 Decimal
Places)
P-value
(Use 4 Decimal
Places)
P-value
(Use 4 Decimal
Places)
Module 2 Answers: Page 10
(Yes or No)
(Yes or No)
Significant Effect?
(p<.05)
(Yes or No)
(Yes or No)
(Yes or No)
Significant Effect?
(p<.05)
(Yes or No)
(Yes or No)
Significant Effect?
(p<.05)
(Yes or No)
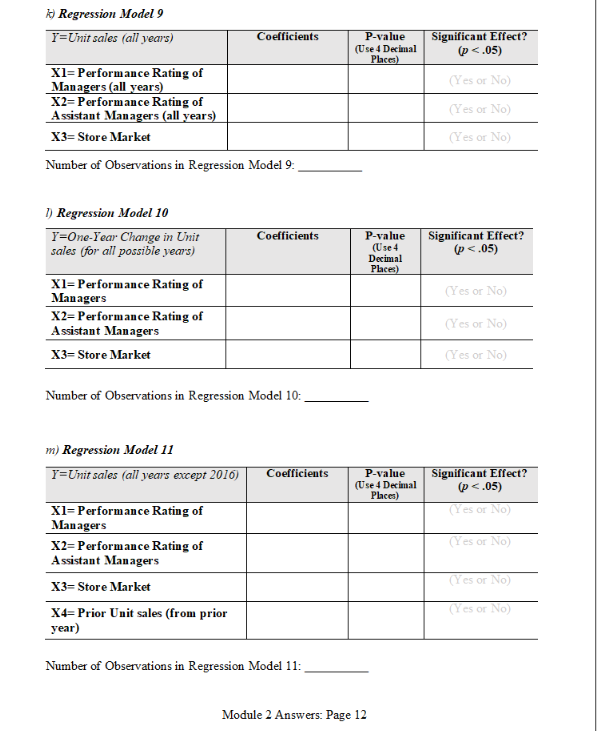
(Yes or No)/nk) Regression Model 9
Y=Unit sales (all years)
X1= Performance Rating of
Managers (all years)
X2= Performance Rating of
Assistant Managers (all years)
X3= Store Market
Number of Observations in Regression Model 9:
1) Regression Model 10
Y=One-Year Change in Unit
sales (for all possible years)
Xl-Performance Rating of
Managers
X2= Performance Rating of
Assistant Managers
X3= Store Market
m) Regression Model 11
Y=Unit sales (all years except 2016)
Coefficients
Number of Observations in Regression Model 10:
X1= Performance Rating of
Managers
X2= Performance Rating of
Assistant Managers
X3= Store Market
X4=Prior Unit sales (from prior
year)
Coefficients
Coefficients
Number of Observations in Regression Model 11:
P-value
(Use 4 Decimal
Places)
P-value
(Use 4
Decimal
Places)
P-value
(Use 4 Decimal
Places)
Module 2 Answers: Page 12
Significant Effect?
(p<.05)
(Yes or No)
(Yes or No)
(Yes or No)
Significant Effect?
(p<.05)
(Yes or No)
(Yes or No)
(Yes or No)
Significant Effect?
(p<.05)
(Yes or No)
(Yes or No)
(Yes or No)
(Yes or No)/nn) To answer this question, (1) identify which model (preferably one model, but few more
are okay if you want to make any comparison) you will bring and present to the Head of
HR Analytics, (2) briefly interpret your finding(s) and takeaway(s) from the model you
picked, and (3) justify why you think it is better than any other regression models.
Please concisely make your point in a plain language for the Head of HR
department using no more than 200 words at maximum.
Answer: