Tasks for Electrical Bridging Assessment ALL ANSWERS MUST BE YOUR OWN WORK Note: Copy and paste these cover and task sheets to the front of your written work as you must
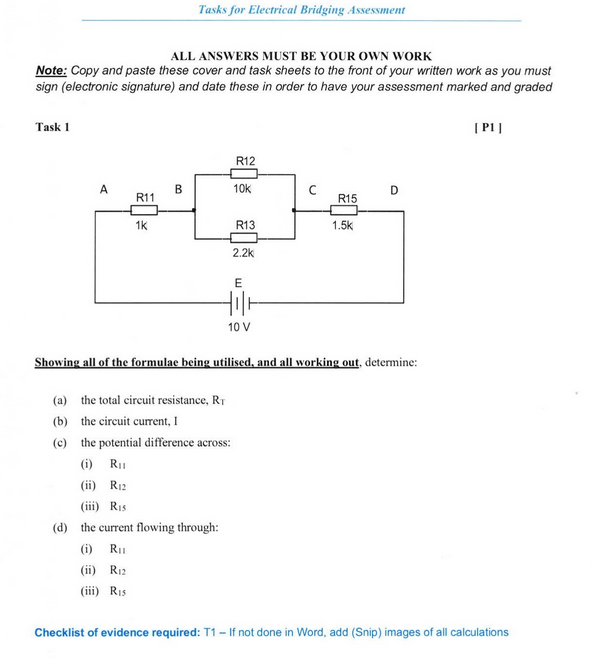
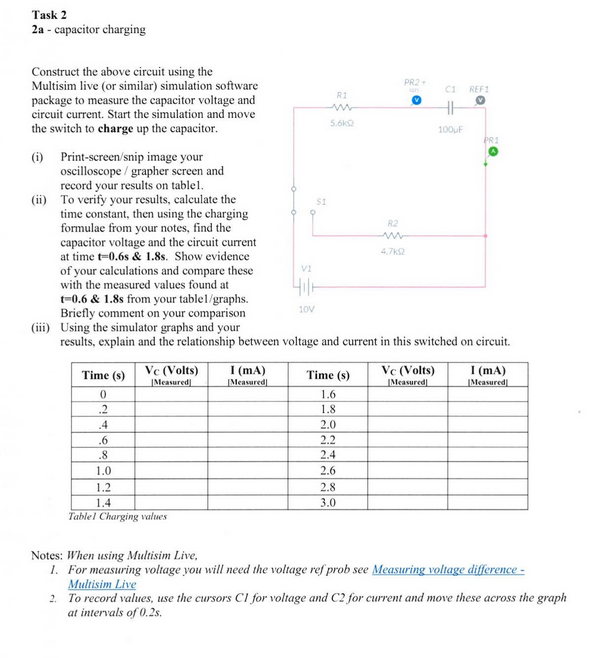
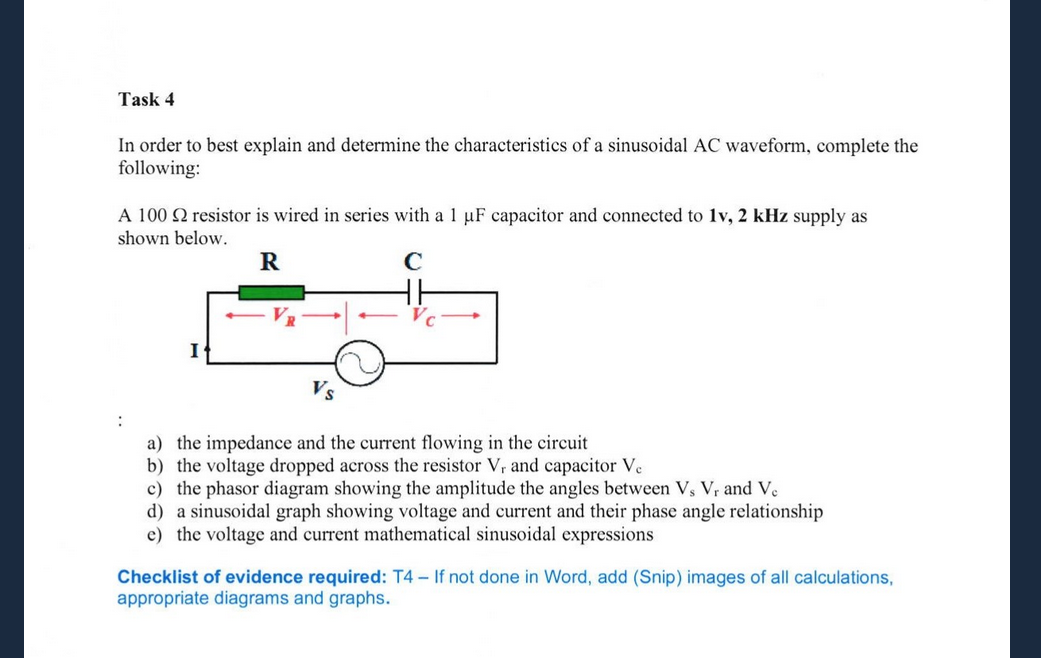
sign (electronic signature) and date these in order to have your assessment marked and graded Task 1 R12 A B 10k C D R11 R15 1K R13 1.5k 2.2k E Hill 10 V Showing all of the formulae being utilised, and all working out, determine: (a) the total circuit resistance, RT (b) the circuit current, I (c) the potential difference across: (i) Ril [P1] (ii) R12 (iii) Ris (d) the current flowing through: (i) RII (ii) R12 (iii) Ris Checklist of evidence required: T1 - If not done in Word, add (Snip) images of all calculations/nTask 2 2a capacitor charging Construct the above circuit using the Multisim live (or similar) simulation software package to measure the capacitor voltage and circuit current. Start the simulation and move the switch to charge up the capacitor. (i) Print-screen/snip image your oscilloscope/grapher screen and record your results on tablel. (ii) To verify your results, calculate the time constant, then using the charging formulae from your notes, find the capacitor voltage and the circuit current at time t=0.6s & 1.8s. Show evidence of your calculations and compare these with the measured values found at t-0.6 & 1.8s from your table1/graphs. Briefly comment on your comparison (iii) Using the simulator graphs and your V1 Hile 10V R1 w 5.600 R2 w 4,7k PR2+ C1 REF1 100uF PR1 results, explain and the relationship between voltage and current in this switched on circuit. Time (s) Vc (Volts) Measured I (mA) Measured] 0 .2 .4 .6 .8 1.0 1.2 1.4 Tablel Charging values Time (s) Vc (Volts) Measured I (mA) Measured 1.6 1.8 2.0 2.2 2.4 2.6 2.8 3.0 Notes: When using Multisim Live, 1. For measuring voltage you will need the voltage ref prob see Measuring voltage difference - Multisim Live 2. To record values, use the cursors CI for voltage and C2 for current and move these across the graph at intervals of 0.2s./n2b-capacitor discharging. Construct the above circuit using the Multisim live (or similar) simulation software package to measure the capacitor voltage and circuit current. Set the switch to ensure the capacitor is fully charged Start the simulation and move the switch to discharge down the capacitor. (iv) Print-screen/snip image your oscilloscope/grapher screen and record your results on tablel. (v) To verify your results, calculate the time constant, then using the charging formulae from your notes, find the capacitor voltage and the circuit current w C1 REF1 R1 ° 100uF 5.60 R2 w 4.700 VI at time t-0.6s & 1.8s. Show evidence of your calculations and compare these 10V with the measured values found at t=0.6 & 1.8s from your tablel/graphs. Briefly comment on your comparison (vi) Using the simulator graphs and your results, explain and the relationship between voltage and current in this switched on circuit. Time (s) Vc (Volts) Measured I (mA) Measured Time (s) Ve (Volts) Measured I (mA) Measured 0 1.6 .2 1.8 .4 2.0 .6 2.2 .8 2.4 1.0 2.6 1.2 2.8 1.4 3.0 Table2 Discharging values Checklist of evidence required: T4: images of build and test of circuits with graphs screens (e.g. use Windows Snipping tool). Provide shared link to your Multisim live circuit. Completed results tables and results commentary (100 words)/nTask 3 This task will cover an experimental investigation into the forward and reverse voltage against current characteristics of two diode types. a) For a standard and zener (5.1v) diode, carry out the experiment on a circuit simulator (e.g. Yenka or Multisim) over a range of positive (+0.1:0.85v with 222) and negative voltages (-1:12v with 1k2) on the circuit arrangements below. b) You are required to record your results in the table, use a spread sheet or hand drawn graph both diodes (see sample graph layout, with V on horz. axis & mA on vert. axis), c) Add images showing evidence of the circuit simulator in use, oscilloscope for the 2 diodes at +0.6 v and -8.0v d) Comment on your findings against the diode characteristics discussed in your notes (100-200 words) Voltage (V) (Horz. Axis) 0.85 0.8 0.75 0.7 0.65 0.6 0.55 0.5 0.4 0.3 0.2 0.1 0 -1 -2 -3 -4 -5 -6 -7 -8 -9 -10 -11 -12 Diodes Standard Current (mA) Zener Forward bias Current (mA) 7.91 7.91 222 222 676 576 850 mV 850 mV Reverse bias 0.00 110 -12.0 12 V Standard Diode IkQ -12 -10 -5.07 12 V Zener Diode 10 5 -5 -10 -15 Checklist of evidence required: T3: images of ECAD build and test of circuits, copy of graphs screens andompleted results tables (e.g. use Windows Snipping tool). Also include comparison commentary./nTask 4 In order to best explain and determine the characteristics of a sinusoidal AC waveform, complete the following: A 100 2 resistor is wired in series with a 1 uF capacitor and connected to 1v, 2 kHz supply as shown below. R VR C a) the impedance and the current flowing in the circuit b) the voltage dropped across the resistor Vr and capacitor Ve c) the phasor diagram showing the amplitude the angles between Vs Vr and Vc d) a sinusoidal graph showing voltage and current and their phase angle relationship e) the voltage and current mathematical sinusoidal expressions Checklist of evidence required: T4 - If not done in Word, add (Snip) images of all calculations, appropriate diagrams and graphs.