Search for question
Question

Final Data Analysis Project

22-665 Data Analytics

Scenario. You are the owner of a minor league baseball team. You have seven employees working in the ticket sales area. They are all sales representatives and the current manager is retiring so you would like to promote one of the salespeople to be the new manager. Along with the general manager and human resources supervisor, you will choose the new ticketing manager from the current employees.

Since you like data to drive your decision-making in all areas of your business, you have decided to develop an analytics system to evaluate the performance of the current employees to assist with the hiring decision. Before you examine the data presented by the human resources office and develop a system to determine analytically who should be the employee promoted to ticketing manager, you should consider some examples of how data have been applied successfully in human resources in the past. Once you have determined some ways that you might approach this process, apply that information to the Excel file relating to the seven current employees. Remember you cannot violate any laws so you have to be careful in your choice. Your final project should include the following components.

Executive Summary and Background. An executive summary (written in narrative form) of necessary background research and the methodology you used to determine which employee to promote. This should include an explanation and justification of the method you used and a summary from at least three peer-reviewed journal article sources of how data analytics can be applied to human resource settings. This section should not exceed two pages, double-spaced, 12 point font, 1-inch margins. If you choose a presentation, this section should not exceed five slides. Cite all sources used for this section in APA style. Remember, this section should include appropriate background research you have conducted to inform your modeling and decision making process. For example, justify using research why you developed the analysis system you did.

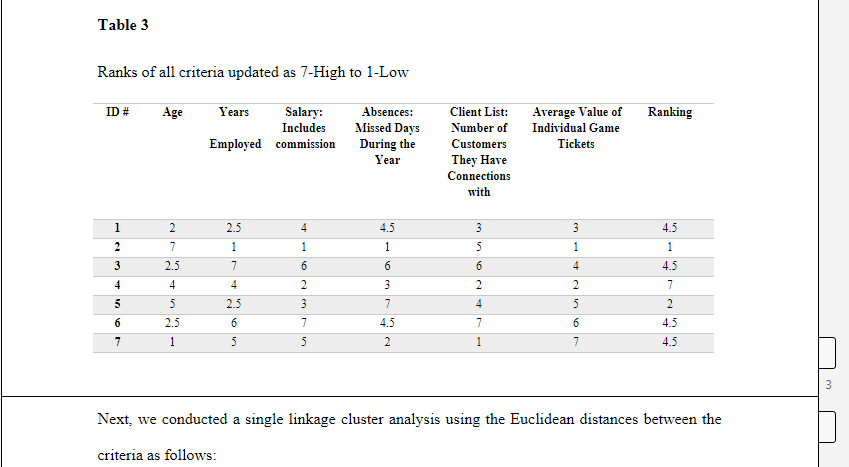
Modeling and rationale. Describe the data analysis process you used to determine how to best spend the money. Defend your process with evidence of why it would be effective. Include at least one APA style table and at least two APA style figures that display the results of your data analysis and brief narrative descriptions of the tables and/or figures using your best data-geek language that we have practiced in class. 

Conclusion and Reflection. Outline the strengths and weaknesses of your analytics system, including what other information would have been helpful in the development of your system. Also include a brief reflection of the process, including answers to these three questions: (1) what did you learn during this process, (2) what can you apply in the future, and (3) how have you changed your thinking about data analytics?

General considerations. You have two options for completing this assignment. You can construct a Powerpoint Presentation or you can submit your work in the form of a Paper. If you write a paper, you should have 1-inch margins, use 12 point font and Times New Roman. If you choose a presentation, you should follow the best practices for presentations. In addition, you presentation should include a narrated voice-over presentation. For both options: All references should be in APA style. The project should be written professionally with no errors. Data analysis modeling is clear and data are displayed in both narrative format and with appropriate tables/figures/or other data visualization tools.

Fig: 1